
![]()
Price: $149.99
Body composition metrics: Weight, Weight Trend, BMI, Body Fat %, Body Water %, Skeletal Muscle Mass, and Bone Mass
Additional data displayed: Daily weather
Max. weight: 400 lbs
Weight measurements: Pounds, Kilograms, Stones
Dimensions: 12.6” x 12.2” x 1.1” (320 x 310 x 28 mm)
Weight: 4.4 lbs (2.0 kg)
Max. # of users: 16
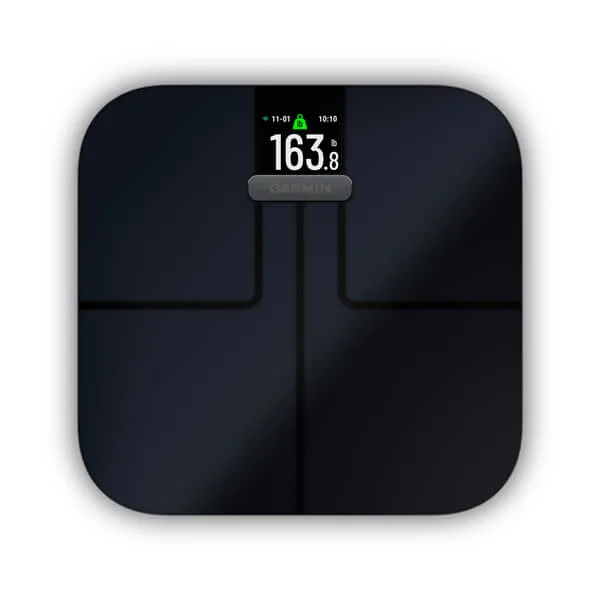
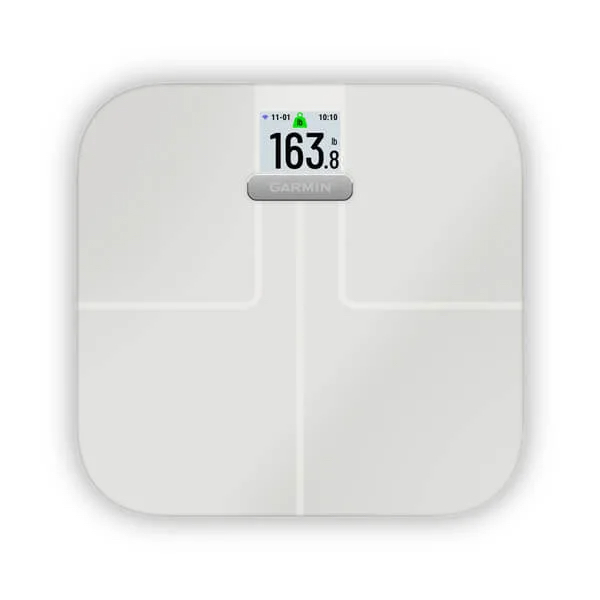
Colors: Black, White
Battery type: 4 AAA batteries
Battery life: approx. 9 months
Availability: Online and retail
Obtained by: Company sample
RBR advertiser: No
Going Beyond Measuring Just Weight
Cyclists can be weight weenies, focusing on staying thin to increase their power-to-weight ratio. But weight isn’t everything. With the new Garmin Smart Scale Index S2, you can measure key body composition metrics, monitor them over time, and see if you’re meeting your goals.
Out of the box, it was easy to set up, connect to my home WiFi, and monitor/track data with the Garmin Connect app. For people owning the earlier version of the Garmin Smart Scale, note that historical data will not transfer over; thus, you’ll start collecting new body composition metrics from day one with the S2 version.
The S2 accommodates up to 16 users, making it ideal for the whole family or sports team. To differentiate between users, the scale displays the initials or four-character names used when setting up the S2 via the Garmin Connect app will display on the scale.
To start your weigh-in, wake up the scale. Once it is awake, make sure you see your initials/name before stepping on the scale. If multiple people share one scale, you may need to “flip through” the names to find yours. Next, step on the scale and wait for the flashing green, meaning the weight is locked in. Finally, you can step off the scale and watch it cycle through the different data screens.
I put my old scale and the S2 side-by-side to see the accuracy of the weight. It was dead on. For the other metrics, I have no way to determine accuracy. However, after a bout of food poisoning and losing 4 pounds in 24 hours, I did see the body water percentage drop dramatically, confirming dehydration by doing a skin pinch test.
Which Body Composition Metrics Are Captured, and What Do They Mean?

The Index S2 scale uses bioelectrical impedance to calculate various body composition metrics. The device sends a small amount of electrical current (which you don’t feel) from one foot through your body to the other foot. The measurements include:
- Weight – this measurement can be set in kilograms, pounds, or stones using a switch on the scale’s underside. With all the sophistication, why isn’t this a toggle in the Garmin Connect app is beyond me. A goal weight can be set and monitored on the scale and in the Garmin Connect app.
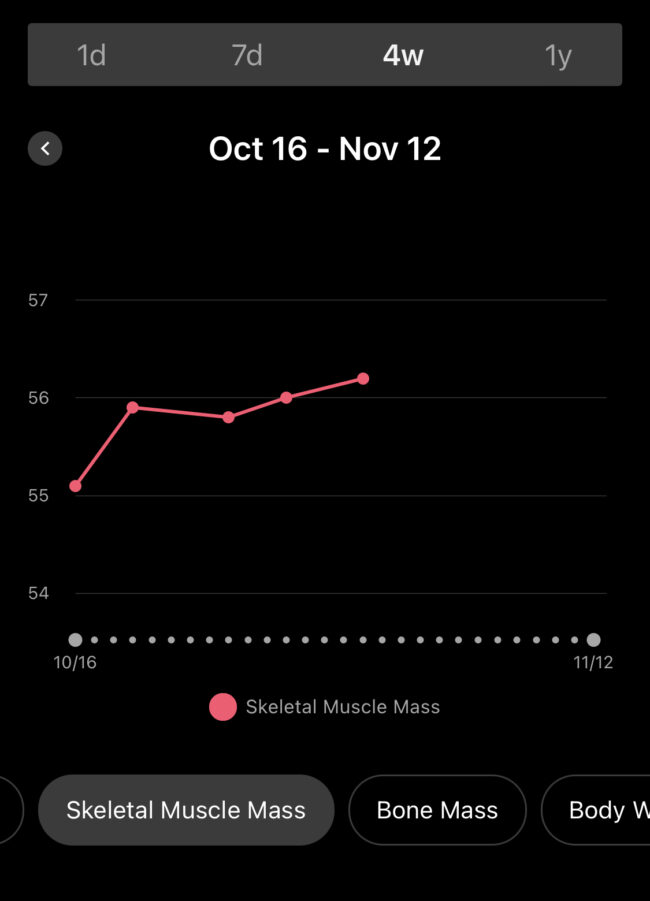
- Weight Trend – view how your weight has changed during the past 30 days and for longer trends, view in the Garmin Connect app.
- Body Mass Index (BMI) – this figure is your weight divided by the square of your height. A high BMI can indicate high body fat.
- Body Fat % – this number shows what percentage of your mass makes up of essential and stored fat.
- Body Water % – being hydrated is vital to your health; this percentage shows your total mass from fluids.
- Skeletal Muscle Mass – this shows the skeletal muscle on your body and tracks how much muscle you’re building.
- Bone Mass – this number shows how much of your weight is bone mass.
- Weather – displays the day’s forecast.

Each number captured during a weigh-in is important for tracking your training progress and goals. Weigh in before and after a ride to see how well you are hydrated. The body water percentage number should remain fairly constant if you hydrate sufficiently during a ride.
I found this article for more information on body composition metrics and averages by sex and weight. It’s a few years old, and the numbers get adjusted every few years, but it’s a good baseline.
What’s in the Box?
Besides the scale, there are four AAA batteries and four feet to use on carpeted surfaces. According to the company, the batteries should last up to 9 months. I guess it will depend on how often you weigh yourself and how many people use the scale.
The company sample I received was white, and the unit also is available in black. In some of the online reviews I read, the black was hard to keep clean. But, as with black cars or appliances, I can imagine keeping it looking clean is a challenge.
Bottom Line
The bathroom scale I had been using only measured weight. With the new Garmin Smart Scale Index S2, the additional body composition metrics help me monitor more aspects of my health and training. Plus, it lets me view them over time, not just daily. I was eager to get on the scale to see how I was tracking, especially regarding muscle mass and hydration.
Sheri Rosenbaum regularly contributes articles and reviews products for RBR. She’s an avid recreational roadie who lives in the Chicago area and a major advocate for women’s cycling, serving on the board of directors and volunteering with the Dare2tri Paratriathlon Club. Click to read Sheri’s full bio or visit her web site sunflowersandpedals.com.
Sheri, always like to get your observations and insights into products.
I purchased the S2 approximately 6 weeks ago. I like that it automatically includes my weight in my training stats w/o having to go to Connect and manually add. I also found that it agreed precisely with my previous digital scale that I have used for the last 10 years.
I am skeptical of some of the analysis that it is providing. I am 78 years old. In a period of less than 24 hours, my Skeletal Muscle Mass changed from 67.7 lbs to 68.4 lbs. I find it highly unlikely that I gained 0.7 lbs of muscle mass in one day with 30 minutes of exercise. Likewise, when checking my weight after 45 minutes in a hot tub, my bone mass went from 8.8 lbs to 9.1 lbs. These measurements were made w/o moving the scale and in my birthday suit fully dried.
Perhaps these values will be more meaningful when taken over a longer range of data, but this is not stated anywhere in their literature. I do not find any information on how they make adjustments for age in their algorithims. I suspect there are differences in how a weight gain/loss gets distributed betweeen the various components with age. It will be interesting to follow the trend in these stats over an extended period of time this Winter and next Spring as I go through a cycle of weight gain, loss of fitness and condition recover once riding outside again.
Yes, my son bought a similar device for about $150USD. Very accurate, precise, reproducible etc for body weight versus other devices and even better showed my body fat as 7%. Cheerfully adjusted the default setting to my minutes of daily exercise and that shot my body fat up to 15%. I was told “that’s the benefit of AI”. Hmmm, maybe the world pre-AI was a better place!
Yes, my son bought a similar device for about $150USD. Very accurate, precise, reproducible etc for body weight versus other devices and even better showed my body fat as 7%. Cheerfully adjusted the default setting to my minutes of daily exercise and that shot my body fat up to 15%. I was told “that’s the benefit of AI”. Hmmm, maybe the world pre-AI was a better place!
According to literature on Wikipedia BIA is not sufficiently accurate to measure individual BMI or anything else.